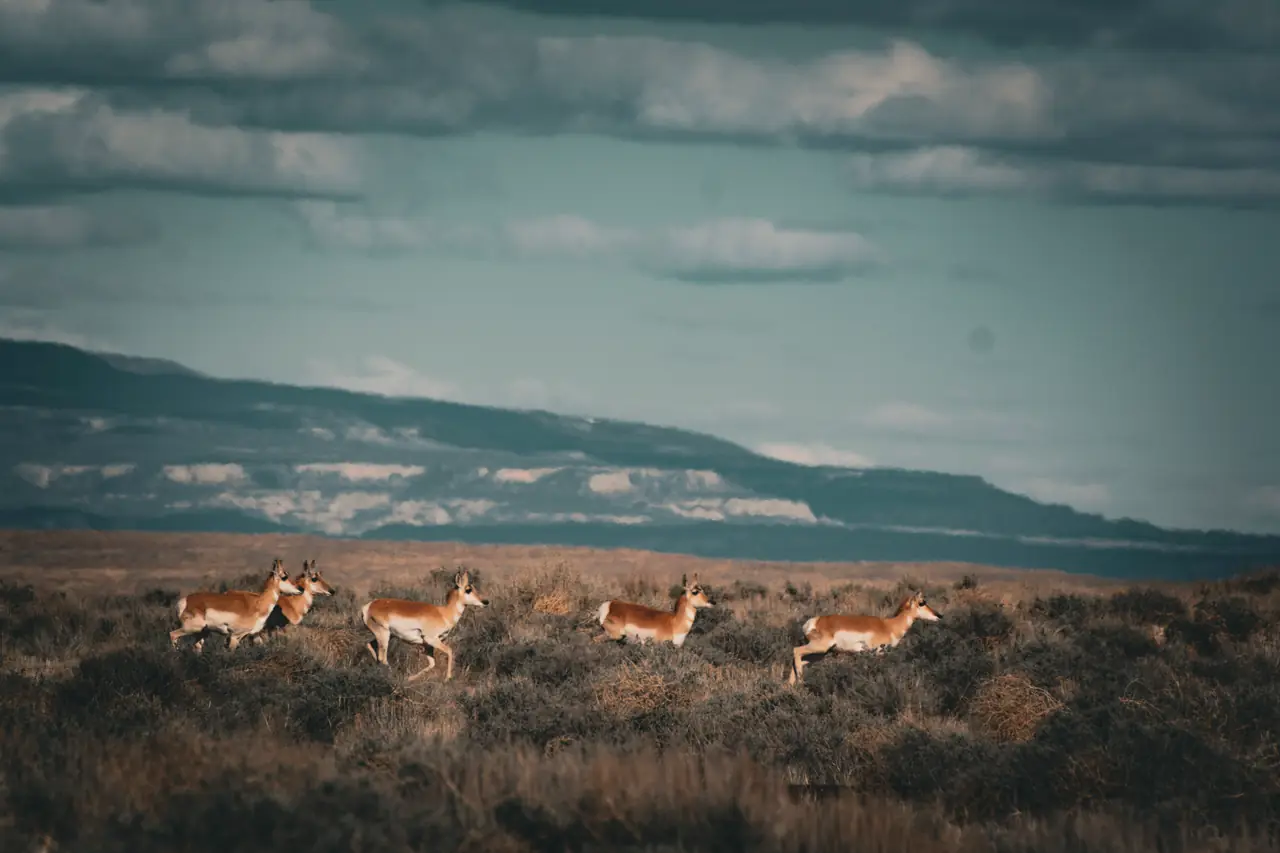
Photo: BLM · public domain
- Hunts this season
- 6
- Season
- 2025
Hunts in this unit by opportunity score
- Overall draw rate
- The share of applicants the agency's report counts who drew the hunt: every choice it prints applicants for, first choices only, or authorized permits per first and second choices, as the row says. It is not your chance of drawing.
- Filled their tag
- How often hunters who drew that tag actually harvested.
- Opportunity
- Higher means a hunt you can both draw and fill.
| Hunt | GMUs | Overall draw rate | Filled their tag | Opportunity | Year |
|---|---|---|---|---|---|
| ANT-1-258 | 59 | about 1 in 6 drew, 16% | 7 harvested, 8 hunters, few hunters, 88% | 13.7 | 2025 |
| ANT-1-259 | 59 | about 1 in 11 drew, 9.1% | 74 of 100, 74% | 6.7 | 2025 |
| ANT-1-255 | 59 | about 1 in 11 drew, 8.8% | 68 of 100, 68% | 6.0 | 2025 |
| ANT-1-257 | 59 | about 1 in 15 drew, 6.8% | 77 of 100, 77% | 5.2 | 2025 |
| ANT-2-254 | 59 | about 1 in 7 drew, 14% | 26 of 100, 26% | 3.6 | 2025 |
| ANT-1-256 | 59 | fewer than 1 in 100 drew, 0.4% | 82 of 100, 82% | 0.3 | 2025 |
Every draw-rate, success-rate and opportunity-score figure here is read from published reports — a guide to relative opportunity, never a guarantee of a tag or a harvest. Figures cover seasons through 2025; data last refreshed Nov 3, 2026. Source: New Mexico Department of Wildlife. Odds & Antlers is an independent product, not affiliated with or endorsed by it.