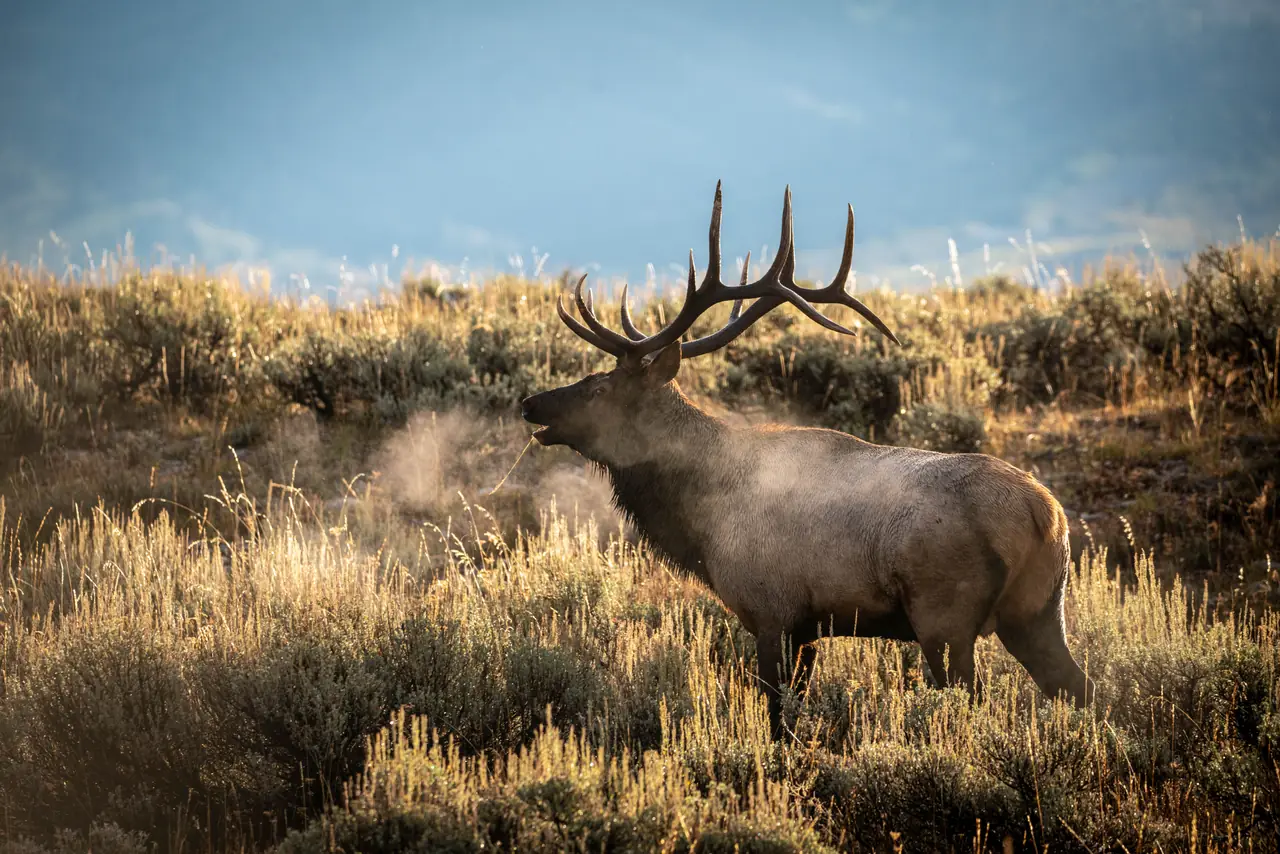
Draw odds × success rate
Draw the tag. Then fill it.
Most draw tools stop at your odds of getting drawn. Odds & Antlers ranks every hunt by whether you can both draw it and punch your tag — so you chase realistic, productive hunts instead of long-shot trophy tags or easy-to-draw dead ends.
Free to explore — no account needed.
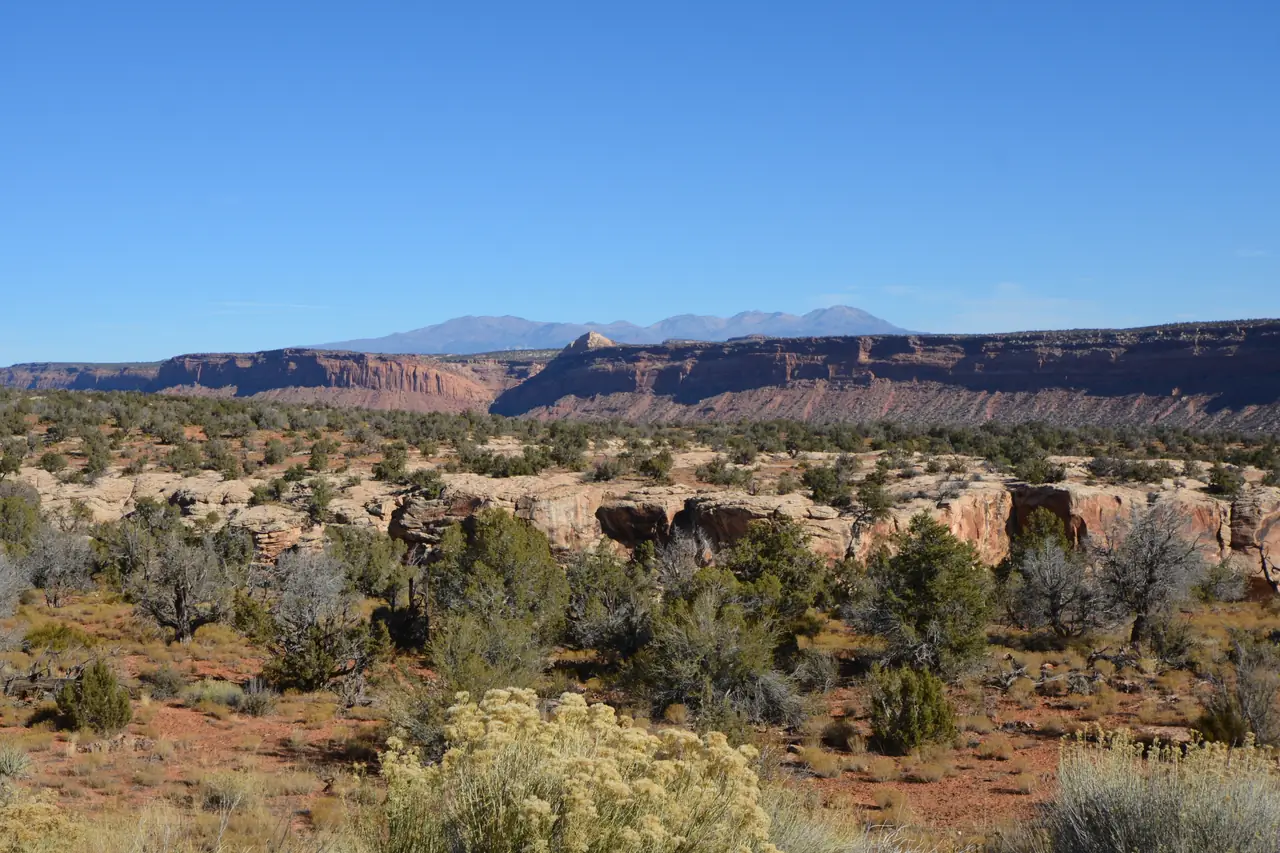
Photo: NPS · public domain
How it works
One score for a realistic, productive hunt
The opportunity score folds the two numbers that actually decide your season into a single, comparable rank.
Every draw and harvest figure above is a published rate from official draw and harvest reports, and the score is computed from two of them — not a guarantee. The real draw is random; we show you where the numbers point, plainly, so the call stays yours.
Browse by state
Draw odds, state by state
Every state we cover has its own page: its species, its units and the hunts in each, ranked. Free to browse — no account needed.
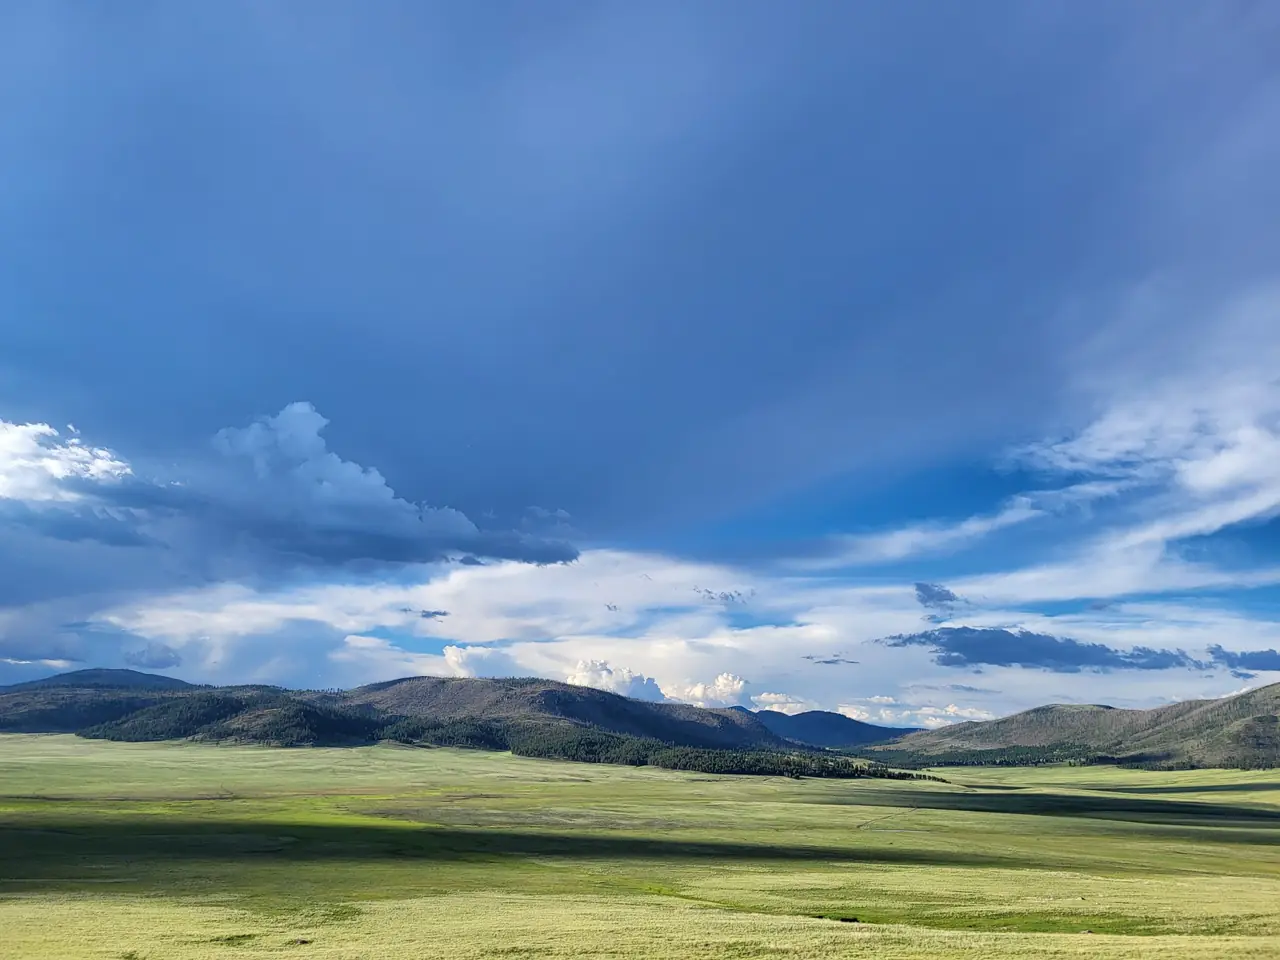 New Mexico
Photo: NPS · public domain
Free account
Track your season, free
Exploring the data needs no account. Create one — also free — to keep your hunts, lists, and plans between visits.
- Saved huntsBookmark the hunts you're weighing and keep them a click away between visits.
- WatchlistsGroup hunts into named lists — your elk plan, your backup deer tags, a friend's unit.
- Draw-deadline remindersTrack each application deadline on your saved hunts so a good tag never slips by unapplied.
- Party buildingSet up your group application with everyone's residency pool; Pro checks the group limit, the tags in each pool and each member's eligibility.
Straight with you
Honest about the numbers
Every figure here comes from the covered wildlife agencies’ published draw and harvest reports. Odds & Antlers is an independent tool — not affiliated with, endorsed by, or speaking for any wildlife agency. Numbers are published rates, not guarantees — see how our data works, and always confirm dates and rules against the official source before you apply.