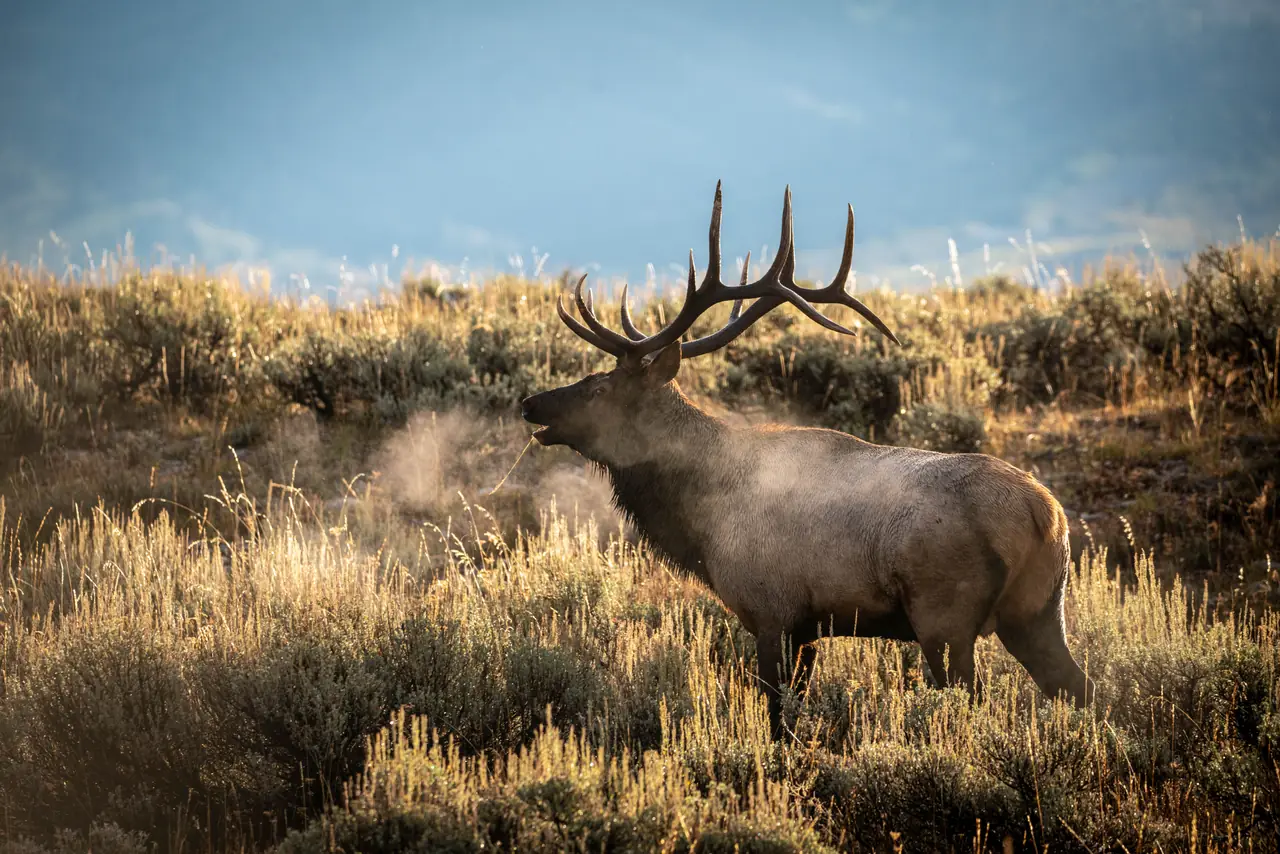
Photo: NPS · public domain
- Hunts tracked
- 521
- Season
- 2025
Top hunts by opportunity score
- Overall draw rate
- The share of applicants the agency's report counts who drew the hunt: every choice it prints applicants for, first choices only, or authorized permits per first and second choices, as the row says. It is not your chance of drawing.
- Filled their tag
- How often hunters who drew that tag actually harvested.
- Opportunity
- Higher means a hunt you can both draw and fill.
| Hunt | GMUs | Overall draw rate | Filled their tag | Opportunity | Year |
|---|---|---|---|---|---|
| ELK-1-318 | 34 | about 9 in 10 drew, 85% | 55 of 100, 55% | 47.3 | 2020 |
| ELK-1-116 | 5A | about 1 in 4 drew, 28% | 5 harvested, 4 hunters, few hunters, 100% | 27.8 | 2019 |
| ELK-1-410 | 55A | about 4 in 10 drew, 42% | 66 of 100, 66% | 27.7 | 2020 |
| ELK-1-210 | 52 | about 5 in 10 drew, 50% | 53 of 100, 53% | 26.5 | 2025 |
| ELK-1-361 | 28 | about 1 in 3 drew, 29% | 8 harvested, 9 hunters, few hunters, 89% | 25.8 | 2022 |
| ELK-1-132 | 10 | 113 of 137 drew on their first three choices, plus 7 on a fourth, 88% | 29 of 100, 29% | 25.6 | 2019 |
| ELK-3-124 | 9 | about 9 in 10 drew, 94% | 7 harvested, 26 hunters, few hunters, 27% | 25.2 | 2022 |
| ELK-1-218 | 12 | about 6 in 10 drew, 55% | 44 of 100, 44% | 24.3 | 2019 |
| ELK-2-288 | 21B | about 6 in 10 drew, 57% | 9 harvested, 21 hunters, few hunters, 43% | 24.3 | 2020 |
| ELK-1-161 | 10 | about 8 in 10 drew, 82% | 29 of 100, 29% | 24.1 | 2025 |
| ELK-1-114 | 5A | about 3 in 10 drew, 33% | 6 harvested, 9 hunters, few hunters, 67% | 22.2 | 2020 |
| ELK-1-115 | 5A | about 1 in 5 drew, 21% | 9 harvested, 7 hunters, few hunters, 100% | 21.4 | 2022 |
| ELK-1-221 | 12 | 57 of 119 drew on their first three choices, plus 7 on a fourth, 54% | 39 of 100, 39% | 20.9 | 2019 |
| ELK-1-328 | 21B | about 3 in 10 drew, 31% | 8 harvested, 12 hunters, few hunters, 67% | 20.7 | 2023 |
| ELK-1-217 | 12 | about 5 in 10 drew, 47% | 44 of 100, 44% | 20.6 | 2019 |
| ELK-1-181 | 52 | about 5 in 10 drew, 48% | 42 of 100, 42% | 19.9 | 2022 |
| ELK-3-204 | 52 | about 7 in 10 drew, 65% | 30 of 100, 30% | 19.6 | 2023 |
| ELK-1-393 | 5455 | 26 of 39 drew on their first three choices, plus 14 on a fourth, 100% | 18 of 100, 18% | 18.4 | 2022 |
| ELK-1-294 | 21B | about 3 in 10 drew, 34% | 8 harvested, 15 hunters, few hunters, 53% | 18.2 | 2020 |
| ELK-1-396 | 28 | about 1 in 5 drew, 20% | 8 harvested, 9 hunters, few hunters, 89% | 18.2 | 2025 |
| ELK-1-220 | 12 | about 4 in 10 drew, 43% | 42 of 100, 42% | 18.1 | 2019 |
| ELK-1-391 | 53 | about 5 in 10 drew, 52% | 35 of 100, 35% | 18.0 | 2025 |
| ELK-1-147 | 4 | about 1 in 4 drew, 28% | 9 harvested, 14 hunters, few hunters, 64% | 17.9 | 2019 |
| ELK-1-382 | 56 | about 1 in 5 drew, 20% | 6 harvested, 7 hunters, few hunters, 86% | 17.5 | 2020 |
| ELK-1-180 | 52 | about 3 in 10 drew, 34% | 51 of 100, 51% | 17.2 | 2020 |
Units
- 10
- 12
- 13
- 14
- 15
- 16A
- 16B
- 16C
- 16D
- 16E
- 17
- 18
- 19
- 2
- 21A
- 21B
- 22
- 23
- 24
- 28
- 29
- 2C
- 30
- 34
- 36
- 37
- 38
- 39
- 4
- 42
- 43
- 45
- 47
- 48
- 49
- 50
- 51
- 52
- 53
- 54
- 55
- 55A
- 56
- 57
- 58
- 59
- 5A
- 5B
- 6A
- 6B
- 6C
- 7
- 9
Elk in New Mexico
New Mexico's big-game draw is purely random. Every application is randomly assigned a sequence number, and a computer examines each application in its entirety — first choice, then second, then third — before moving to the next. The state explicitly does not grant preference to applicants who were unsuccessful in previous drawings, so there is no point ladder to climb: each year is a fresh chance.
Licenses in each hunt are split by quota. The draw attempts to distribute a minimum of 84 percent of licenses to New Mexico residents, 10 percent to residents or nonresidents who have contracted with a registered New Mexico outfitter, and 6 percent to nonresidents applying without an outfitter. That is why the draw statistics on this page are broken out by residency class — the pool you apply in is the pool your odds come from.
You can enter up to three elk hunt codes as choices, and elk (like deer) allows a fourth "quadrant" choice covering a region of the state. Before applying you must first buy an annual game-hunting license with the Habitat Management and Access Validation, and the nonrefundable application fee plus the full license fee are charged when you submit.
The Department of Wildlife manages elk in three zones — Primary, Secondary and Special management zones. In Primary zones it actively monitors herd productivity and adjusts license numbers to keep herds within sustainable population metrics. Hunts are offered across rifle, muzzleloader and archery, on both public and private land. Private-land elk hunting runs through EPLUS, the Elk Private Lands Use System, under which qualified landowners are issued elk authorizations they may distribute — a separate path to a tag that does not go through the public draw.
The tables on this page show, per hunt code and residency class, what the draw and harvest data actually look like. Treat any odds or opportunity score here as a published rate from past seasons — a way to compare hunts, not a guarantee of drawing or filling a tag.
Every draw-rate, success-rate and opportunity-score figure here is read from published reports — a guide to relative opportunity, never a guarantee of a tag or a harvest. Figures cover seasons through 2025; data last refreshed Nov 3, 2026. Source: New Mexico Department of Wildlife. Odds & Antlers is an independent product, not affiliated with or endorsed by it.