- Hunts tracked
- 534
- Season
- 2025
Top hunts by opportunity score
- Overall draw rate
- The share of applicants the agency's report counts who drew the hunt: every choice it prints applicants for, first choices only, or authorized permits per first and second choices, as the row says. It is not your chance of drawing.
- Filled their tag
- How often hunters who drew that tag actually harvested.
- Opportunity
- Higher means a hunt you can both draw and fill.
| Hunt | GMUs | Overall draw rate | Filled their tag | Opportunity | Year |
|---|---|---|---|---|---|
| DER-1-143Private land only | 5A | nearly all drew, 100% | 81 of 100, 81% | 81.4 | 2019 |
| DER-1-145Private land only | 5A | nearly all drew, 98% | 53 of 100, 53% | 52.5 | 2023 |
| DER-1-135Private land only | 4 | about 9 in 10 drew, 94% | 56 of 100, 56% | 52.2 | 2020 |
| DER-1-290 | 31 | about 7 in 10 drew, 73% | 66 of 100, 66% | 47.9 | 2019 |
| DER-3-147Private land only | 5A | about 9 in 10 drew, 88% | 55 of 100, 55% | 47.7 | 2022 |
| DER-1-339 | 40 | about 5 in 10 drew, 53% | 90 of 100, 90% | 47.6 | 2019 |
| DER-2-145Private land only | 5A | nearly all drew, 100% | 40 of 100, 40% | 40.3 | 2019 |
| DER-3-141Private land only | 4 | about 8 in 10 drew, 75% | 53 of 100, 53% | 40.1 | 2021 |
| DER-1-110 | 2B | about 9 in 10 drew, 87% | 45 of 100, 45% | 38.9 | 2025 |
| DER-3-149Private land only | 5A | nearly all drew, 98% | 39 of 100, 39% | 38.2 | 2025 |
| DER-1-116Private land only | 2B | about 9 in 10 drew, 94% | 38 of 100, 38% | 35.8 | 2024 |
| DER-1-291 | 31 | about 6 in 10 drew, 55% | 65 of 100, 65% | 35.7 | 2019 |
| DER-1-133 | 4 | about 8 in 10 drew, 83% | 43 of 100, 43% | 35.4 | 2020 |
| DER-3-418 | 58 | about 5 in 10 drew, 54% | 17 harvested, 26 hunters, few hunters, 65% | 35.1 | 2019 |
| DER-2-147Private land only | 5A | nearly all drew, 100% | 35 of 100, 35% | 34.7 | 2023 |
| DER-3-425 | 59 | 16 of 30 drew on their first three choices, plus 5 on a fourth, 70% | 12 harvested, 25 hunters, few hunters, 48% | 33.6 | 2021 |
| DER-1-137Private land only | 4 | about 7 in 10 drew, 69% | 45 of 100, 45% | 30.7 | 2025 |
| DER-3-322 | 36 | about 6 in 10 drew, 62% | 11 harvested, 24 hunters, few hunters, 46% | 28.2 | 2019 |
| DER-1-296 | 30 | about 6 in 10 drew, 55% | 50 of 100, 50% | 27.2 | 2023 |
| DER-1-419 | 59 | about 4 in 10 drew, 42% | 65 of 100, 65% | 26.9 | 2019 |
| DER-3-275 | 27 | 18 of 43 drew on their first three choices, plus 9 on a fourth, 63% | 42 of 100, 42% | 26.3 | 2022 |
| DER-3-269 | 25 | about 6 in 10 drew, 59% | 44 of 100, 44% | 25.8 | 2023 |
| DER-2-261 | 24 | 23 of 39 drew on their first three choices, plus 24 on a fourth, 100% | 26 of 100, 26% | 25.6 | 2025 |
| DER-2-409 | 57 | about 5 in 10 drew, 46% | 55 of 100, 55% | 25.4 | 2020 |
| DER-2-140Private land only | 4 | nearly all drew, 100% | 25 of 100, 25% | 25.4 | 2019 |
Units
- 10
- 12
- 13
- 14
- 15
- 16
- 17
- 18
- 19
- 20
- 21
- 22
- 23
- 24
- 25
- 26
- 27
- 28
- 29
- 2A
- 2B
- 2C
- 30
- 31
- 32
- 33
- 34
- 36
- 37
- 38
- 39
- 4
- 40
- 41
- 42
- 43
- 45
- 47
- 48
- 49
- 50
- 51A
- 51B
- 52
- 53
- 54
- 55
- 55A
- 56
- 57
- 58
- 59
- 5A
- 5B
- 6A
- 6C
- 7
- 8
- 9
Deer in New Mexico
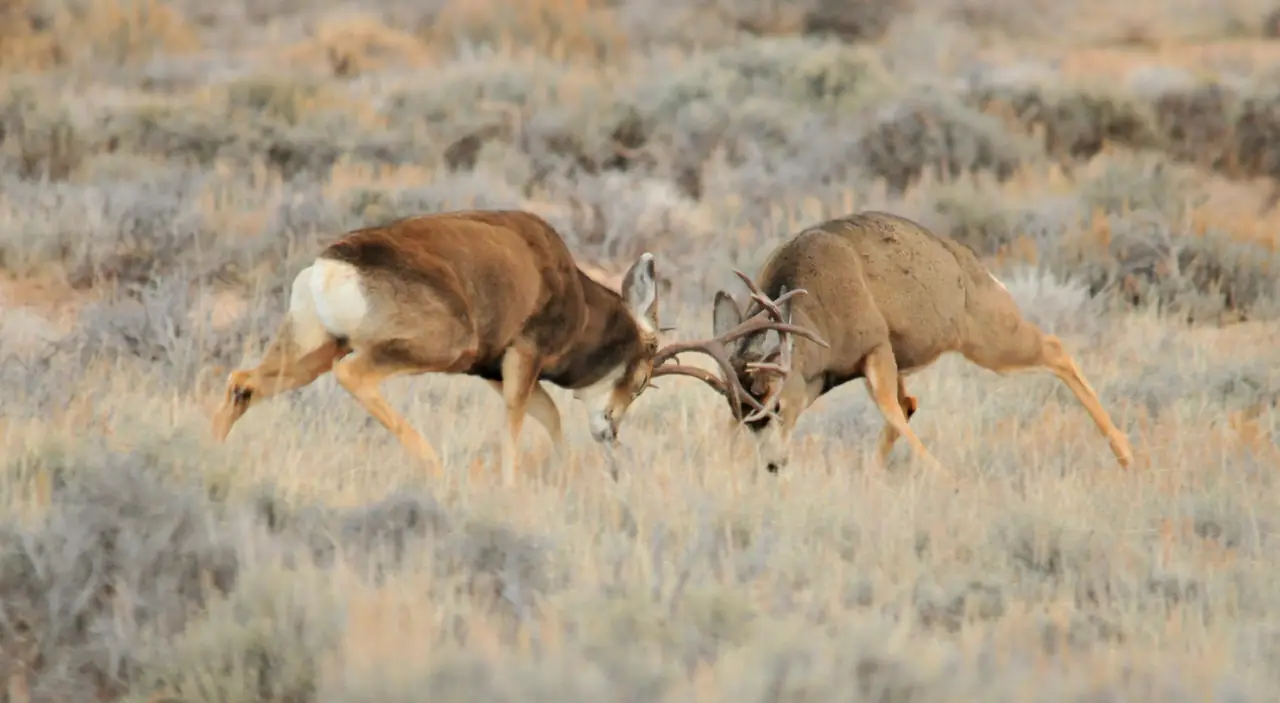
New Mexico deer hunting is predominantly a mule deer pursuit, but the state also offers distinctive opportunities for both Coues white-tailed deer and Texas white-tailed deer. The Department of Wildlife describes deer habitat here as running from the alpine country of the Sangre de Cristo Range down to the desert floors of the southwest — the hunt-code system is how that variety gets packaged into specific units, dates and weapon types.
The draw itself is random, with no bonus or preference points: every application receives a random sequence number, and each application's choices are examined in order — first, second, then third — before the computer moves on. New Mexico explicitly does not grant preference to previously unsuccessful applicants. Licenses within each hunt are split by quota: a minimum of 84 percent to residents, 10 percent to outfitter-sponsored applicants, and 6 percent to non-outfitted nonresidents — which is why this page breaks the numbers out by residency class. You may list up to three deer hunt codes, plus a fourth "quadrant" choice covering a region of the state (an option only deer and elk applications have). Before applying you must hold an annual game-hunting license with the Habitat Management and Access Validation, and the full license fee is charged up front with the application.
Beyond the public draw, the Department offers private-land-only deer licenses, and it structures hunts as standard or quality hunt types across rifle, muzzleloader and archery. Buck hunting dominates: except in a few specific instances, does may not be harvested. Deer management leans on post-hunt aerial surveys of buck-to-doe and fawn-to-doe ratios to track population trends, with weather, disease and predation among the drivers the Department names for herd fluctuation.
The draw and harvest tables on this page show how each hunt code has actually performed by residency class. Read the odds as the agency's published rates and the opportunity scores as figures computed from them, built from past seasons — useful for comparing hunts, never a promise about the next draw.
Every draw-rate, success-rate and opportunity-score figure here is read from published reports — a guide to relative opportunity, never a guarantee of a tag or a harvest. Figures cover seasons through 2025; data last refreshed Nov 3, 2026. Source: New Mexico Department of Wildlife. Odds & Antlers is an independent product, not affiliated with or endorsed by it.