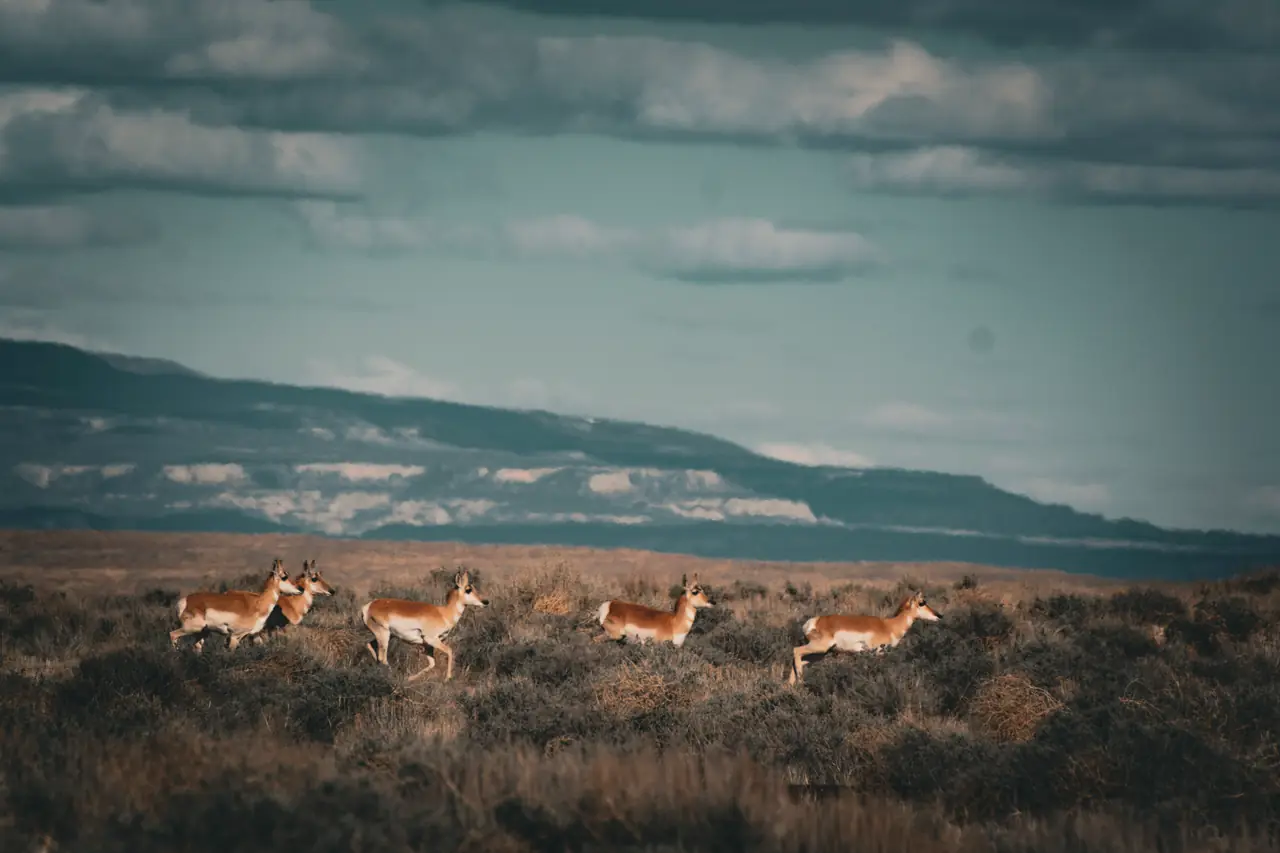
Photo: BLM · public domain
- Hunts tracked
- 339
- Season
- 2025
Top hunts by opportunity score
- Overall draw rate
- The share of applicants the agency's report counts who drew the hunt: every choice it prints applicants for, first choices only, or authorized permits per first and second choices, as the row says. It is not your chance of drawing.
- Filled their tag
- How often hunters who drew that tag actually harvested.
- Opportunity
- Higher means a hunt you can both draw and fill.
| Hunt | GMUs | Overall draw rate | Filled their tag | Opportunity | Year |
|---|---|---|---|---|---|
| AM106O1R | 106 | nearly all drew, 96% | 70 of 100, 70% | 66.7 | 2025 |
| AF004P5RPrivate land only | 45 | about 7 in 10 drew, 68% | 84 of 100, 84% | 57.7 | 2021 |
| AM140O1R | 140147 | about 9 in 10 drew, 93% | 61 of 100, 61% | 57.2 | 2024 |
| AF004W2RRanching for Wildlife | 4 | about 6 in 10 drew, 59% | 94 of 100, 94% | 55.2 | 2022 |
| AM134O1R | 134 | about 7 in 10 drew, 73% | 72 of 100, 72% | 52.3 | 2025 |
| AM129P1RPrivate land only | 129 | about 8 in 10 drew, 83% | 62 of 100, 62% | 51.3 | 2022 |
| AM003P5RPrivate land only | 3301 | about 7 in 10 drew, 68% | 74 of 100, 74% | 50.1 | 2022 |
| AM141P1RPrivate land only | 141 | about 8 in 10 drew, 84% | 58 of 100, 58% | 49.0 | 2023 |
| AM130P1RPrivate land only | 130146 | about 8 in 10 drew, 81% | 60 of 100, 60% | 48.7 | 2024 |
| AM012P5RPrivate land only | 1223 | about 5 in 10 drew, 47% | 12 harvested, 12 hunters, few hunters, 100% | 46.7 | 2025 |
| AF142O1M | 142 | about 7 in 10 drew, 73% | 63 of 100, 63% | 46.1 | 2021 |
| AM132P1RPrivate land only | 132139145 | about 7 in 10 drew, 70% | 64 of 100, 64% | 44.7 | 2025 |
| AM110O1M | 110111118119123124 | about 9 in 10 drew, 90% | 50 of 100, 50% | 44.6 | 2025 |
| AM009O1M | 1919 | about 7 in 10 drew, 73% | 6 harvested, 10 hunters, few hunters, 60% | 44.0 | 2024 |
| AF214P5RPrivate land only | 214441 | about 6 in 10 drew, 57% | 77 of 100, 77% | 43.8 | 2022 |
| AM112O1M | 112113114115 | about 8 in 10 drew, 79% | 55 of 100, 55% | 43.0 | 2023 |
| AM124O1R | 124 | about 6 in 10 drew, 57% | 73 of 100, 73% | 42.0 | 2025 |
| AM116O1M | 116117122127 | about 8 in 10 drew, 83% | 50 of 100, 50% | 41.3 | 2025 |
| AF133P5RPrivate land only | 133134140141147 | about 7 in 10 drew, 67% | 61 of 100, 61% | 40.9 | 2024 |
| AF003P5RPrivate land only | 3301 | about 6 in 10 drew, 55% | 74 of 100, 74% | 40.5 | 2022 |
| AF018P5RPrivate land only | 18181272837 | about 7 in 10 drew, 71% | 57 of 100, 57% | 40.5 | 2025 |
| AF006O1M | 16161171716 | about 8 in 10 drew, 78% | 52 of 100, 52% | 40.4 | 2023 |
| AF106O1R | 106 | about 6 in 10 drew, 57% | 70 of 100, 70% | 40.3 | 2021 |
| AM135P1RPrivate land only | 135 | about 9 in 10 drew, 89% | 44 of 100, 44% | 39.1 | 2021 |
| AF107O1R | 107 | about 6 in 10 drew, 57% | 69 of 100, 69% | 39.0 | 2024 |
Units
- 1
- 10
- 100
- 101
- 102
- 104
- 105
- 106
- 107
- 109
- 11
- 110
- 111
- 112
- 113
- 114
- 115
- 116
- 117
- 118
- 119
- 12
- 120
- 121
- 122
- 123
- 124
- 125
- 126
- 127
- 128
- 129
- 13
- 130
- 131
- 132
- 133
- 134
- 135
- 136
- 137
- 138
- 139
- 140
- 141
- 142
- 143
- 144
- 145
- 146
- 147
- 15
- 16
- 161
- 17
- 171
- 18
- 181
- 191
- 2
- 201
- 211
- 214
- 23
- 231
- 26
- 27
- 28
- 3
- 30
- 301
- 37
- 4
- 441
- 48
- 481
- 49
- 5
- 50
- 500
- 501
- 55
- 551
- 56
- 57
- 58
- 581
- 59
- 591
- 6
- 66
- 67
- 68
- 681
- 682
- 69
- 691
- 7
- 79
- 791
- 8
- 80
- 81
- 82
- 83
- 84
- 85
- 851
- 86
- 861
- 87
- 88
- 89
- 9
- 90
- 93
- 95
- 951
- 97
- 98
- 99
Pronghorn in Colorado
Colorado pronghorn follows the state's standard two-draw structure, with one notable open door: hunters who skip the draw entirely can buy over-the-counter archery buck and doe pronghorn licenses when they go on sale in August. Rifle and muzzleloader pronghorn, and the better archery units, run through the draws.
The primary draw takes one application per species with up to four hunt choices and requires a qualifying license purchase first — the qualifying license must be in your cart before the application. Miss your first-choice hunt code and you earn a pronghorn preference point; the point ladder is what separates the routinely drawn hunt codes from the coveted ones. Qualifying applications also ride the hybrid draw, an extra random chance at premier hunt codes. The secondary draw follows, open to anyone regardless of whether they entered the primary, covering most pronghorn licenses the primary didn't issue, with no preference points used or awarded. Applications run in early spring; specific season dates live in the annual Big Game Brochure.
CPW's limited-license inventory for pronghorn spans several categories worth recognizing in the hunt tables: public-land licenses, private-land-only licenses, Ranching for Wildlife licenses on enrolled ranches, season-choice licenses and leftover limited licenses. The Landowner Preference Program also allocates pronghorn vouchers to qualifying private landowners.
The tables on this page show how each pronghorn hunt code has drawn and harvested. Treat the odds as the agency's published rate across the whole applicant pool: in a preference-point system, your own point balance moves your real chances well off the average.
Every draw-rate, success-rate and opportunity-score figure here is read from published reports — a guide to relative opportunity, never a guarantee of a tag or a harvest. Figures cover seasons through 2025; data last refreshed Nov 4, 2026. Source: Colorado Parks and Wildlife. Odds & Antlers is an independent product, not affiliated with or endorsed by it.