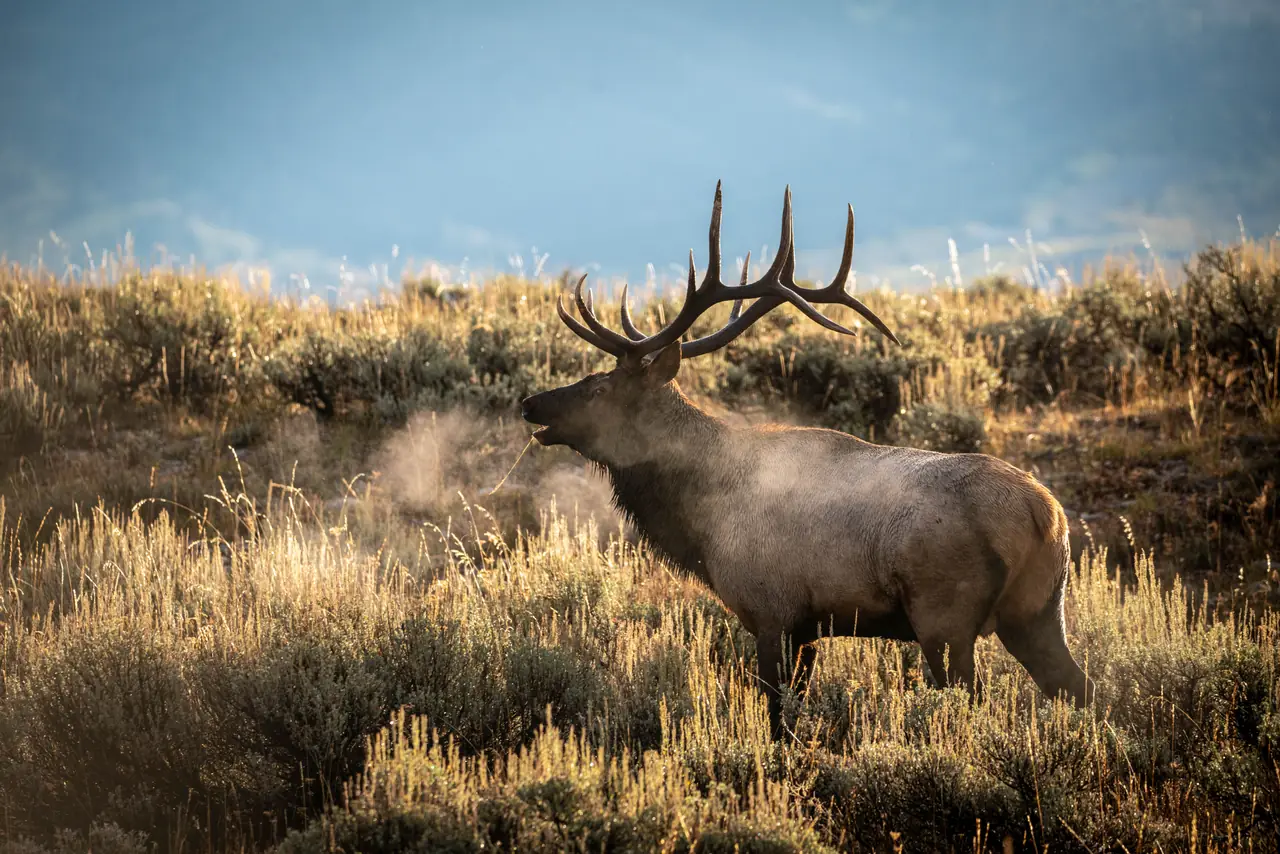
Photo: NPS · public domain
- Hunts this season
- 13
- Season
- 2025
Hunts in this unit by opportunity score
- Overall draw rate
- The share of applicants the agency's report counts who drew the hunt: every choice it prints applicants for, first choices only, or authorized permits per first and second choices, as the row says. It is not your chance of drawing.
- Filled their tag
- How often hunters who drew that tag actually harvested.
- Opportunity
- Higher means a hunt you can both draw and fill.
| Hunt | GMUs | Overall draw rate | Filled their tag | Opportunity | Year |
|---|---|---|---|---|---|
| EM038O1M | 38 | about 6 in 10 drew, 55% | 3 harvested, 25 hunters, few hunters, 12% | 6.6 | 2025 |
| EF038P5RPrivate land only | 38 | about 1 in 12 drew, 8.6% | 5 harvested, 8 hunters, few hunters, 63% | 5.4 | 2025 |
| EM038O1R | 38 | about 1 in 10 drew, 9.7% | 5 harvested, 9 hunters, few hunters, 56% | 5.4 | 2025 |
| EE038V1A | 38 | about 7 in 10 drew, 73% | 2 harvested, 28 hunters, few hunters, 7.1% | 5.2 | 2025 |
| EF038L1R | 38 | about 7 in 10 drew, 71% | 6 of 100, 6.1% | 4.3 | 2025 |
| EF038L2R | 38 | about 3 in 10 drew, 33% | 11 of 100, 11% | 3.5 | 2025 |
| EM038O4R | 38 | about 1 in 6 drew, 17% | 1 harvested, 5 hunters, few hunters, 20% | 3.5 | 2025 |
| EF038O4R | 38 | about 1 in 6 drew, 16% | 1 harvested, 5 hunters, few hunters, 20% | 3.3 | 2025 |
| EF038O1R | 38 | about 1 in 5 drew, 20% | 3 harvested, 20 hunters, few hunters, 15% | 3.0 | 2025 |
| EF038O1M | 38 | about 1 in 7 drew, 15% | 0 harvested, 10 hunters, few hunters, 0.0% | 0.0 | 2025 |
| EF038O2R | 38 | about 1 in 13 drew, 7.9% | 0 harvested, 8 hunters, few hunters, 0.0% | 0.0 | 2025 |
| EF038O3R | 38 | about 1 in 8 drew, 12% | 0 harvested, 8 hunters, few hunters, 0.0% | 0.0 | 2025 |
| EF038V1A | 38 | 0 of 2 drew, few applicants, 0.0% | 0 harvested, 2 hunters, few hunters, 0.0% | 0.0 | 2025 |
Preference-point draw: the overall draw rate is the pool rate across all point levels and all choices, not adjusted for your accumulated points. Because that overall rate also counts applicants who listed the hunt as a later choice, it can read well under 100% on a hunt where every first choice drew. It also overstates your chance on premium, high-demand tags if you hold few points. Where the state publishes draw figures by point level, each hunt's page shows them under “Odds by points”.
Every draw-rate, success-rate and opportunity-score figure here is read from published reports — a guide to relative opportunity, never a guarantee of a tag or a harvest. Figures cover seasons through 2025; data last refreshed Nov 4, 2026. Source: Colorado Parks and Wildlife. Odds & Antlers is an independent product, not affiliated with or endorsed by it.