- Hunts tracked
- 218
- Season
- 2025
Top hunts by opportunity score
- Overall draw rate
- The share of applicants the agency's report counts who drew the hunt: every choice it prints applicants for, first choices only, or authorized permits per first and second choices, as the row says. It is not your chance of drawing.
- Filled their tag
- How often hunters who drew that tag actually harvested.
- Opportunity
- Higher means a hunt you can both draw and fill.
| Hunt | GMUs | Overall draw rate | Filled their tag | Opportunity | Year |
|---|---|---|---|---|---|
| 1196 | 15A15B15C15D | about 8 in 10 drew, 78% | 17 harvested, 21 hunters, few hunters, 81% | 63.2 | 2025 |
| 1194 | 36A | nearly all drew, 100% | 63 of 100, 63% | 63.0 | 2024 |
| 1104 | 30A | nearly all drew, 100% | 63 of 100, 63% | 62.8 | 2020 |
| 1192 | 16A | about 8 in 10 drew, 77% | 77 of 100, 77% | 59.0 | 2020 |
| 1105 | 30A | nearly all drew, 100% | 55 of 100, 55% | 55.5 | 2020 |
| 1157 | 20C | about 8 in 10 drew, 81% | 68 of 100, 68% | 54.9 | 2024 |
| 1904 | — | about 7 in 10 drew, 67% | 82 of 100, 82% | 54.8 | 2020 |
| 1802 | 5A5B | about 6 in 10 drew, 57% | 20 harvested, 22 hunters, few hunters, 91% | 52.2 | 2024 |
| 1103 | 30A | nearly all drew, 100% | 52 of 100, 52% | 52.2 | 2020 |
| 1107 | 30B | nearly all drew, 95% | 54 of 100, 54% | 51.0 | 2020 |
| 1190 | 36A | nearly all drew, 100% | 49 of 100, 49% | 49.2 | 2020 |
| 1108 | 30B | nearly all drew, 100% | 48 of 100, 48% | 48.1 | 2020 |
| 1901 | — | about 5 in 10 drew, 45% | 10 harvested, 10 hunters, few hunters, 100% | 45.5 | 2020 |
| 1158 | 20B | nearly all drew, 100% | 44 of 100, 44% | 44.4 | 2021 |
| 1133 | 35A | nearly all drew, 99% | 44 of 100, 44% | 43.4 | 2023 |
| 1141 | 36A | about 9 in 10 drew, 94% | 45 of 100, 45% | 42.3 | 2020 |
| 1129 | 34B | nearly all drew, 97% | 42 of 100, 42% | 40.2 | 2020 |
| 1128 | 34B | about 9 in 10 drew, 85% | 46 of 100, 46% | 39.2 | 2020 |
| 1116 | 32 | about 7 in 10 drew, 71% | 55 of 100, 55% | 38.9 | 2020 |
| 1191 | 36A | nearly all drew, 100% | 38 of 100, 38% | 38.3 | 2022 |
| 1142 | 36A | about 8 in 10 drew, 80% | 46 of 100, 46% | 36.9 | 2020 |
| 1159 | 20C | nearly all drew, 100% | 37 of 100, 37% | 36.8 | 2021 |
| 1168 | 35A | about 6 in 10 drew, 64% | 57 of 100, 57% | 36.6 | 2023 |
| 1170 | 35A | about 5 in 10 drew, 46% | 79 of 100, 79% | 36.5 | 2025 |
| 1132 | 35A | about 9 in 10 drew, 91% | 40 of 100, 40% | 36.4 | 2020 |
Units
- 1
- 10
- 11M
- 12A
- 12AE
- 12AW
- 12B
- 12BW
- 13A
- 13B
- 15A
- 15B
- 15C
- 15D
- 16A
- 17A
- 17B
- 18A
- 18B
- 19A
- 19B
- 20A
- 20B
- 20C
- 21
- 22
- 23
- 24A
- 24B
- 27
- 28
- 29
- 2A
- 2B
- 2C
- 30A
- 30B
- 31
- 32
- 33
- 34A
- 34B
- 35A
- 35B
- 36A
- 36B
- 36C
- 37A
- 37B
- 39
- 3A
- 3B
- 3C
- 40
- 40A
- 40B
- 41
- 42
- 43A
- 43B
- 44A
- 44B
- 45A
- 45B
- 45C
- 46A
- 46B
- 4A
- 4B
- 5A
- 5B
- 6A
- 6B
- 7
- 8
- 9
Deer in Arizona
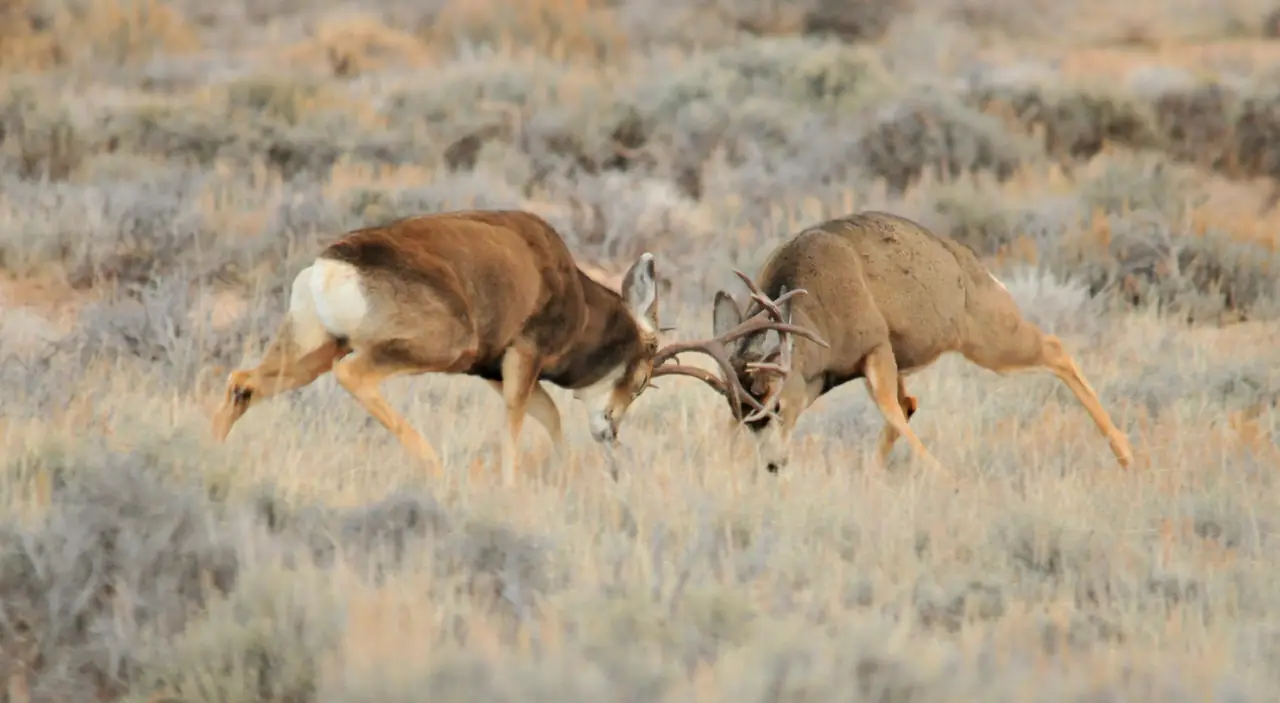
Arizona hunts two deer species — mule deer and whitetail deer — and its regulations treat the pairing as a defining feature: hunt codes specify the legal animal, with some hunts open to any antlered deer and others restricted to antlered mule deer or antlered whitetail only. Reading the "legal wildlife" column on a hunt is as important here as reading the unit.
Access comes in two modes. General, Youth-Only, Muzzleloader, CHAMP and Archery-Only permit-tag hunts require applying through the draw, which runs in its own application cycle separate from Arizona's early-year pronghorn and elk draw. Separately, archery-only nonpermit-tags are sold over the counter at license dealers for designated seasons and units — Arizona's no-draw deer path — valid for one calendar year and carrying mandatory harvest reporting. The baseline bag limit is one deer per calendar year (a second is possible only under a population-management restricted tag), and a valid hunting or combination license is required to hunt or to apply.
The draw itself is a computerized random drawing with bonus points: every valid, unsuccessful application earns a point for the genus, bonus-point-only applications let you bank a point in a year you sit out, and group applications draw together or not at all. Permit-tags remaining after the draw sell first-come, first-served. Youth-only deer hunts give young hunters (with hunter education for ages ten to thirteen) their own permit pools.
Arizona lays its deer hunting over game management units composed of state, federal, military and private land, with season dates and permit numbers set per unit in the annual hunt tables — the granularity this page's data mirrors. The odds and success figures tabled here are the agency's published rates from past draw cycles and reported harvests; in a bonus-point system they are pool-wide averages, so let your own point position, species choice (mule deer versus whitetail) and weapon season shape what "good odds" means for you.
Every draw-rate, success-rate and opportunity-score figure here is read from published reports — a guide to relative opportunity, never a guarantee of a tag or a harvest. Figures cover seasons through 2025; data last refreshed Nov 4, 2026. Source: Arizona Game and Fish Department. Odds & Antlers is an independent product, not affiliated with or endorsed by it.